
Hello! Here is a post that will be documenting a group project for Georgia Tech’s Mobile & Ubiquitous Computing course.
Table of Contents
- Part 1 - Introduction and Background
- Part 2 - Design Iterations and Prototyping
- Part 3 - Embedded Systems Architecture
- Part 4 - Features and Code Highlights
- Part 5 - Reflections and Conclusion
Part 1 - Introduction and Background
Quantitative Sensory Testing (QST) is a validated methodology used to assess sensory nerve function by using a variety of thermal, vibrational, and mechanical stimuli. However, most of the QST tools available today are designed for laboratory use and often cost upwards of $50,000, limiting access to only specialized clinics and research environments. Therefore, many professionals have to resort to crude tools such as ice, pokers, or pinchers instead, which lack the consistency and quantifiable data crucial for accurate diagnosis.
Mentored by Professor Alexander Adams, our group aimed to address this issue, working on developing a new QST tool that applies a consistent and quantifiable sensation, while still being low-cost and accessible.
...
Before jumping into the development process, I want to highlight that this project was a group effort, even if it only focused on my responsibilities.
My primary responsibility was embedded systems development, as I was the only one with experience and interest in that field. Other members were in charge of designing the outer case of the tool using CAD and 3D printing or writing supplementary Python applications. My groupmates’ contributions were crucial in completing the final prototype, and I want to acknowledge their efforts here.
Part 2 - Design Iterations and Prototyping
As most projects go, our tool went through multiple design ideas and prototyping before it was substantialized.
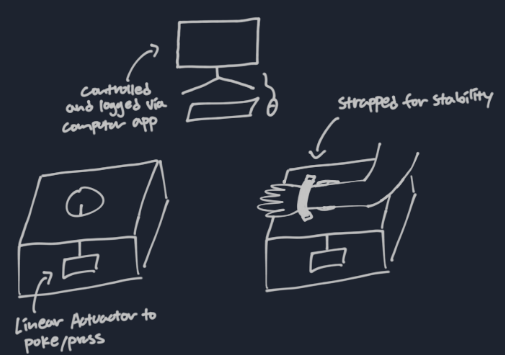
Our first idea was a sort of “torture box” where the patient’s arm was strapped down while a linear actuator pressed/poked from below. This mechanism was the first thing that came to mind, and it seemed fairly basic and easy to implement. However, this idea was dismissed after Professor Adams added that he wanted the tool to be handheld, something small enough to fit in a doctor’s chest pocket (we also had concerns about possible feelings of aversion from patients).
...
After continued brainstorming, we had two ideas to choose from, an air pressure-based system or a piezoresistive effect-based system.
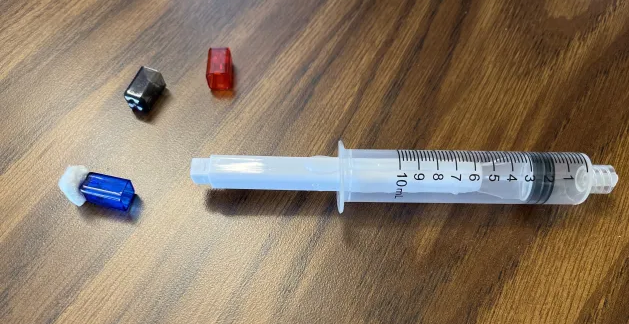
The more immediately intuitive method was the air pressure-based system, where a barometer is placed in the airtight chamber of a syringe. When the tool is pressed down and the plunger depresses, the barometer detects the change in air pressure.
The piezoresistive effect refers to the change in electrical resistivity when mechanical strain is applied to a semiconductor or metal. Using this effect, changes in resistance can be mapped to pressure applied.
Here is a table describing the differences between the two in detail:
| Air Pressure-Based System | Piezoresistive Effect-Based System | |
|---|---|---|
| Accuracy/Precision | High Potential. Can be very sensitive and precise, especially for light forces/touches. | Lower Potential. Limited by seal integrity, friction, and barometer resolution. Inconsistent. |
| Linearity | Often Non-linear. Requires calibration and linearization, especially in “touch mode.” | Highly Non-linear. Pressure scales non-linearly with volume reduction (Boyle’s Law). Requires multi-point calibration and zeroing. |
| Durability/Longevity | Moderate. Repeated flexing can cause material fatigue in thin films. | Low. Plunger seal wear, barrel cracking, and inconsistent friction are major issues. |
| Complexity of Electronics | High. Requires specialized capacitance-to-digital converters, shielding for noise. | Moderate. Standard barometer/pressure sensor interface (e.g., I2C, SPI). |
From this chart, it seems as though using piezoresistive pressure sensors is the right decision. After all, in real-world settings, accuracy and durability are the most important factors to consider.
However, our final choice was the air pressure-based system. To be completely honest, the main reason for this decision was because the barometer was much easier to implement. Though the concept is fairly basic, my group (including me) had very little knowledge of electrical engineering concepts such as the piezoresistive effect and just didn’t want to deal with it with such limited time. Although further expressed in the reflections section below, this is my greatest regret looking back on the project and is the first thing I would change if I were to continue working on it.
...
Here is the final prototype we ended up with:
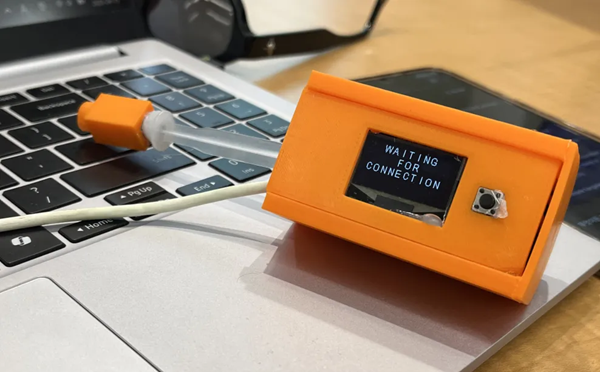
Our QST tool is a handheld wireless device that measures the change in air pressure as force is applied to the depressible tip. It displays data on a built-in OLED screen but can also utilize Bluetooth to connect to a computer.
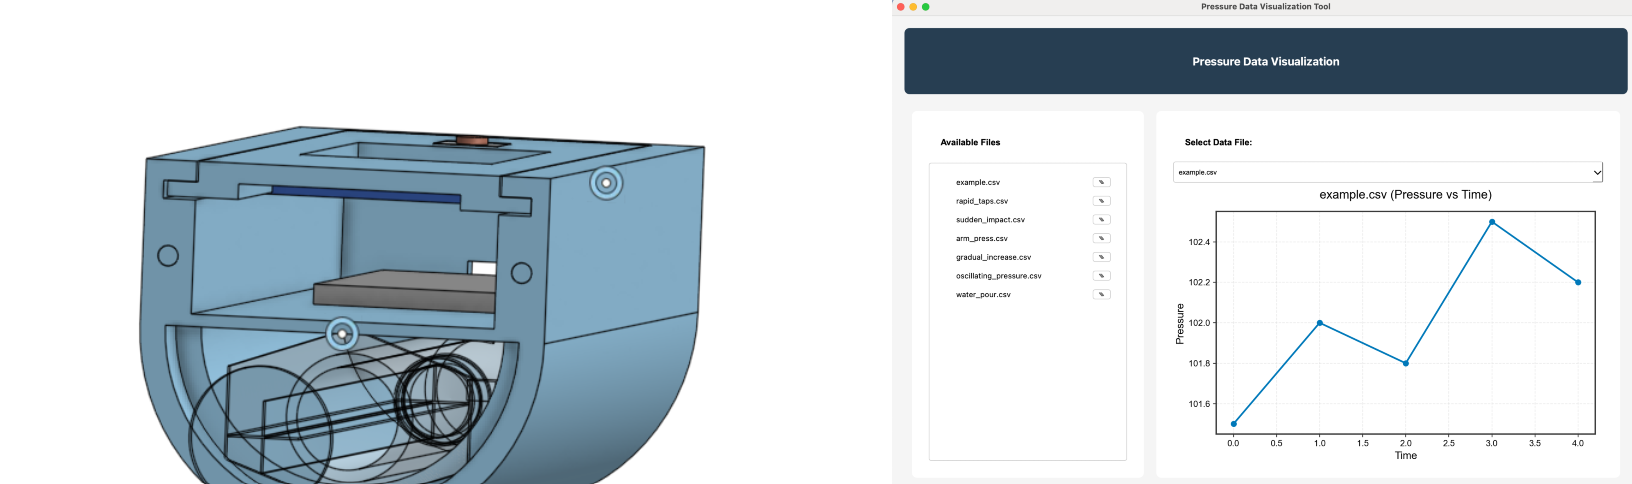
The prototype is complete with a 3D-printed case with a screw-on lid and interchangeable tips, which allows for a wider variety of sensations. We also developed Python applications that log data received through Bluetooth in a CSV file and visualize the data in a neat graph.
Part 3 - Embedded Systems Architecture
Here is a full list of components/tools used:
- TinyPico (ESP32)
- LPS28DFW Barometer
- SSD1306 OLED Monitor
- Pushbutton
- Soldering Kit
Unlike previous projects where I connected all components using a breadboard and jumper wires, this project had the limitation that it needed to be as compact as possible. Because of this, I picked the TinyPico, an ESP32 development board known for its small size (18 x 35mm). It also had a built-in Bluetooth module which helped with reducing the number of components.
I picked the LPS28DFW barometer mainly because it was readily available in Professor Adams' lab.
It was incredibly small, which helped it fit into a smaller syringe, but that also meant it had
direct solder pads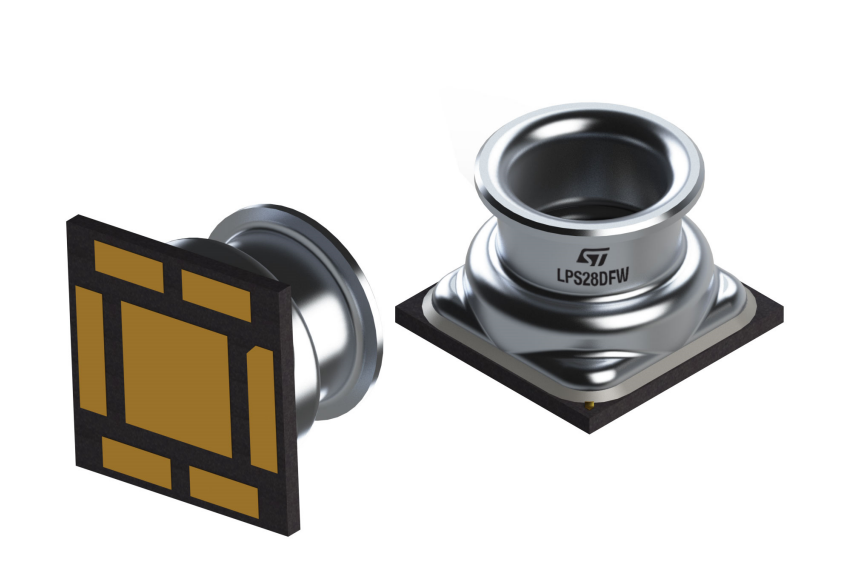 instead of pin headers.
Connecting wires to this chip was incredibly difficult, as soldering required great precision to avoid short-circuiting.
The wires also repeatedly broke off, requiring constant resoldering.
After many grueling hours wrestling with this chip, I can confidently say my soldering skills have improved greatly from before.
instead of pin headers.
Connecting wires to this chip was incredibly difficult, as soldering required great precision to avoid short-circuiting.
The wires also repeatedly broke off, requiring constant resoldering.
After many grueling hours wrestling with this chip, I can confidently say my soldering skills have improved greatly from before.
I used the SSD1306 OLED monitor because it is one of the most commonly used for embedded systems projects, and I just so happened to have some in my room. Since I had previous experience with it, I could also just reuse old code with a few changes.
...
Here is how I organized the file structure for the project.
main -
    Common -
        Globals.h
        HardwareConfig.h
        I2CDrv.h
        I2CDrv.c
    Bluetooth -
        Bluetooth.h
        Bluetooth.c
    Button -
        ButtonDrv.h
        ButtonDrv.c
    OLED -
        Fonts.h
        OLEDDrv.h
        OLEDDrv.c
    PSensor -
        PSensorDrv.h
        PSensorDrv.c
    main.c
I decided to use a modular approach, with a single C file for each major functionality or peripheral. This way, I could improve productivity and portability while making it easier for other people to understand my code.
Part 4 - Features and Code Snippets
Before jumping into code snippets, here is a state diagram describing the process in which the tool operates.
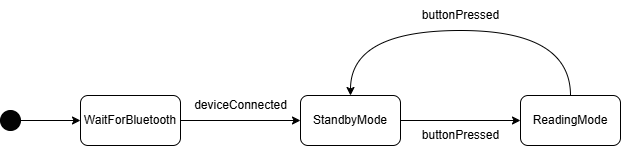
The device has three main states, WaitForBluetooth where it waits for a host to connect with, a StandbyMode where a Georgia Tech logo on the screen indicate the device is ready to read, and a ReadingMode where the device is actively reading air pressure. A simple pushbutton is used to switch between StandbyMode and ReadingMode.
...
Here, I’ll be explaining my code in more detail, which contains device drivers and the main RTOS program. Because this part can get a bit lengthy, I’ll only explain the more interesting parts of the code.
Here is the GitHub repository for the project, here is the user manual for the LPS28DFW barometer, and here is the user manual for the SSD1306 OLED monitor.
PSensorDrv.c
The PSensorDrv file is responsible for initializing the LPS28 chip, sending and receiving data using I2C, and calculating the air pressure in hPa.
Many configurations can be made to the LPS28 during initialization, such as reading temperature or managing interrupts. Because I intended to keep things simple, I only needed to tweak a few registers, all managed in the Sensor_Init function.
void Sensor_Init(void) {
    Sensor_writeReg(I2C_DEVICE_DATARATE, I2C_DEVICE_CTRLREG1);
    Sensor_writeReg(I2C_DEVICE_FSMODE, I2C_DEVICE_CTRLREG2);
}
The first Sensor_writeReg function changes the output data rate to one-shot, which means that the device returns to power-down mode after one acquisition is completed, helping me reduce power consumption.
The second Sensor_writeReg function changes FS_MODE from 0 to 1, which reduces the barometer’s sensitivity by a factor of two while increasing the max pressure cap from 1260 hPa to 4060 hPa. Though sensitivity is one of the most important factors to consider, it was a necessary tradeoff after testing showed that the air pressure in the chamber continuously exceeded 1260 hPa.
OLEDDrv.c
The OLEDDrv file contains functions that initialize the OLED monitor, write characters and strings, and draw the Georgia Tech logo.
Drawing on the screen uses standard bitmap-based rendering, with helper functions to set cursor position and draw bytes from a font array. Below is how I write characters to the screen.
void OLED_writeChar(INT8U charCode, INT8U page, INT16U column) {
    INT8U* fontCharStart = &Font[(charCode - 32) * 24];

    OLED_setCoord(page, column);
    OLED_writeData(fontCharStart, 12);

    OLED_setCoord(page + 1, column);
    OLED_writeData(fontCharStart + 12, 12);
}
...
The other files were all too simple to go over, so here’s a brief overview before I move on to the main file.
ButtonDrv.c : Handles button presses and interrupt initialization
Bluetooth.c : Initializes Bluetooth and SPP for data transmission
Main.c
Here is the main task, which implements the state diagram shown above, utilizing FreeRTOS to manage tasks smoothly.
(Although there is only one task, I still used FreeRTOS so that I could utilize some of its features. I also had to consider possibly expanding on the project in the future.)
// Task that waits reads pressure data and sends it to PC via Bluetooth
void mainTask(void* arg) {
    while (1) {
        // When the task starts (start reading), flush all other semaphores and clear OLED
        if (xSemaphoreTake(semaphoreHandle, portMAX_DELAY) == pdTRUE) {
            while (xSemaphoreTake(semaphoreHandle, 0) == pdTRUE) {}
            OLED_ClearScreen();
            // Read pressure and send via bluetooth every 0.05 seconds
            while (1) {
                INT16U pressure = Sensor_ReadPressure();
                Bluetooth_SendPressureTime(pressure, time);
                // Drawing progress bars
                for (INT8U i = 0; i < 10; i++) {
                    OLED_WriteProgressBar(1, (12 * i) + 4, (pressure - basePressure) * 10 > (maxIncrease * i));
                }
                vTaskDelay(pdMS_TO_TICKS(50));
                // When the task ends (stop reading), write logo and send 0s via bluetooth to signal end
                if (xSemaphoreTake(semaphoreHandle, 0) == pdTRUE) {
                    OLED_WriteLogo();
                    Bluetooth_SendPressureTime(0, 0);
                    time = 0;
                    break;
                }
            }
        }
    }
}
The OLED screen dynamically visualizes the pressure as a progress bar, offering a qualitative indication of the applied force. It uses basePressure, which is calibrated during startup, and maxIncrease, which is arbitrarily set to 1000 hPa for the time being.
Every 0.05 seconds, the device sends the following pair (pressure, time). To stop capturing and return to StandbyMode, it sends (0, 0), which signals to the computer that capturing is over.
...
Here is a video demo of the device at work.
Part 5 - Reflections and Conclusion
Overall, I am proud of this project because of its interdisciplinary approach blending 3D printing, embedded systems, and software visualization. Additionally, the final prototype looks neat and we met the requirements of keeping the device low-cost. However, looking back, there are a lot of changes I would make to this project, if I were to start over.
-
Precision and Durability: Our primary challenge stemmed from chossing the air pressure system over a piezoresistive solution for ease of development. While functional, this choice inherently limited the precision and durability required for a true medical device. This project serves best as a proof of concept, highlighting the potential for low-cost QST tools, but a more robust solution would require the alternative approach.
-
Calibration and Linearity: A significant oversight was the lack of comperhensive calibration and zeroing. Although we implemented a rudimentary baseline capture, factors such as air leaks, temperature shifts, and friction was not accounted for, compromising reliability. Additionally, properly linearizing pressure readings using Boyle’s Law is crucial for accuracy in a real-world application.
-
Connectivity and Power: The current design mandates a Bluetooth Classic connection before readings can begin. Future iterations should offer optional connectivity and transition to BLE (Bluetooth Low Energy) to drastically reduce power consumption. Furthermore, integrating an internal battery is essential to truly achieve a handhold, wireless device as envisioned.
...
In conclusion, this project was a valuable exploration into developing a low-cost, accessible Quantitative Sensory Testing tool. By integrating embedded systems, 3D printing, and software visualization, we successfully created a functional prototype and demonstrated the feasibility of the concept. While the journey highlighted the inherent trade-offs between development expediency and optimal technical solutions, it provided profound insights into the complexities of medical device design. I’m excited by the potential for future iterations to address the identified limitations, bringing a truly consistent and quantifiable sensory assessment tool closer to widespread use.